
G. Chanakya Sree Harsha
I turn messy data into decisions that actually make sense. B.Tech CS Graduate from Malla Reddy University (2025). Ex-Data Analytics Intern at Automotive Robotics India (ARi). Open to work — Data Analyst roles.
About Me
Data Analyst with hands-on experience transforming raw data into actionable business insights through SQL, Python, Power BI, and data warehousing projects. Improved decision-making visibility by building analytics solutions such as an Enterprise Data Warehouse using Medallion Architecture, a Financial Performance Intelligence Dashboard, and Marketing Analytics dashboards, while applying data modeling, ETL workflows, and KPI analysis. Strengthened analytical and problem-solving skills by working on customer behavior analysis, machine learning, and NLP projects, gaining experience across the complete data lifecycle from data preparation to insight generation.
Skills & Toolkit
Languages & Query
Libraries
BI & Visualization
Data Engineering
Cloud & DevOps
AI / ML (Self-Initiated)
Analytical Concepts
Work Experience
Data Analytics Intern
Automotive Robotics India (ARi)📍 Hyderabad, India
- Improved reporting accuracy by approximately 25% by analyzing operational datasets using Python and SQL to support stakeholder reporting.
- Enhanced data reliability by reducing missing values through data cleaning, preprocessing, and validation workflows.
- Reduced manual reporting effort by nearly 40% through ETL optimization and Power BI dashboard automation.
Projects
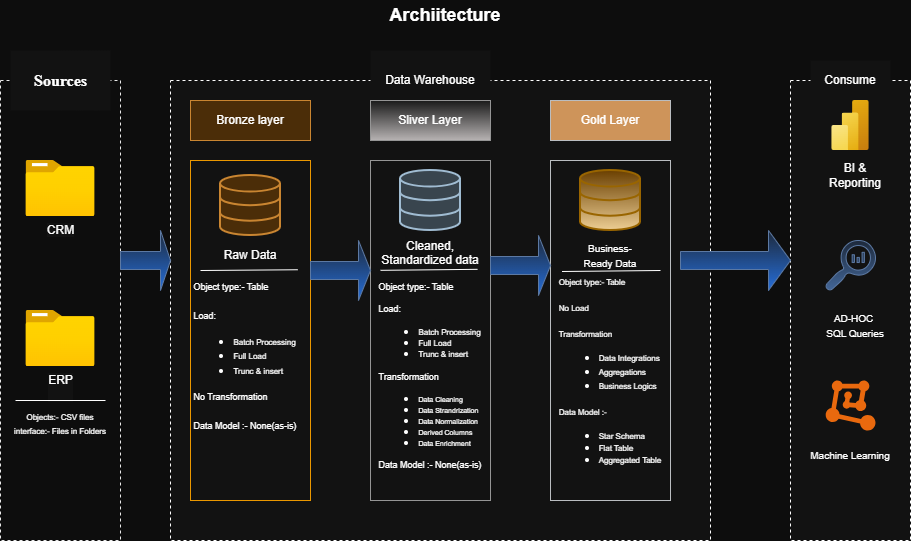
Enterprise Data Warehouse — Medallion Architecture
Designed and implemented a SQL-based Enterprise Data Warehouse using Medallion Architecture (Bronze → Silver → Gold layers). Integrates ERP/CRM data into a Star Schema optimized for corporate sales analytics.
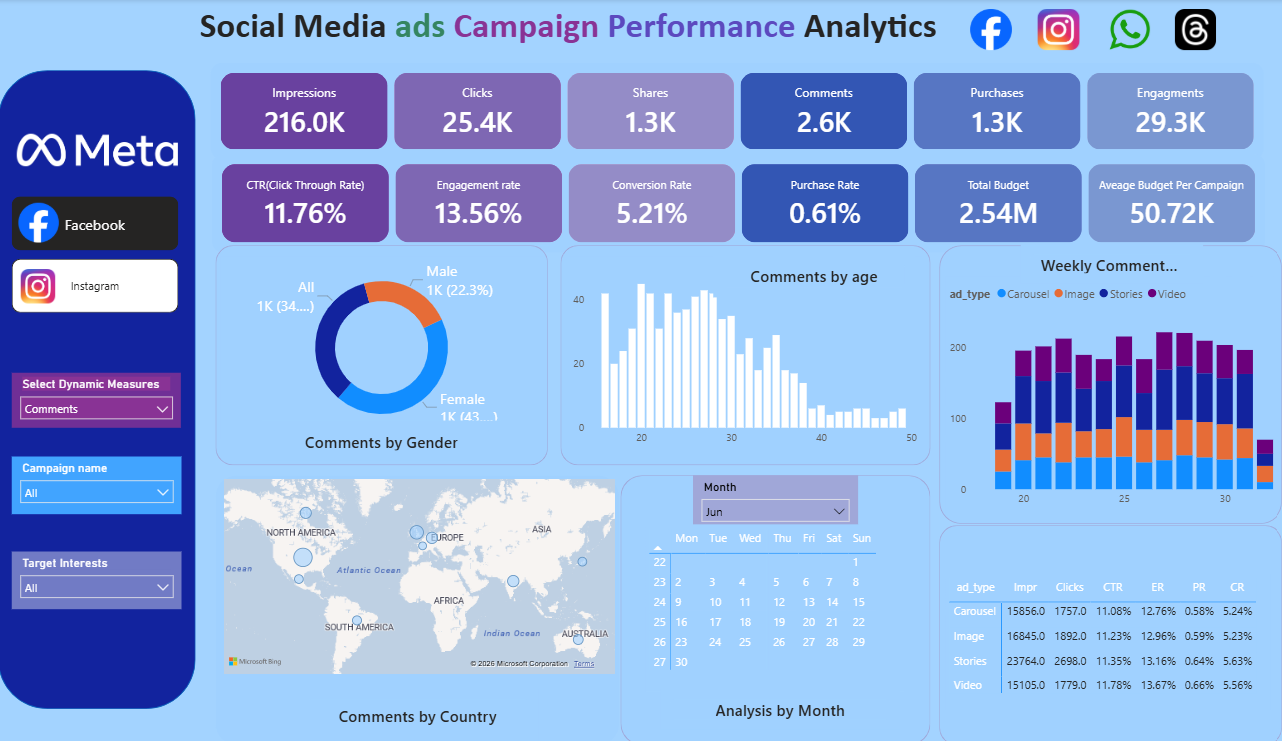
Social Media Ad Campaign Dashboard
Built an end-to-end Power BI marketing analytics solution for a simulated Meta ads environment, turning raw event-level data into a star-schema model and interactive dashboard.
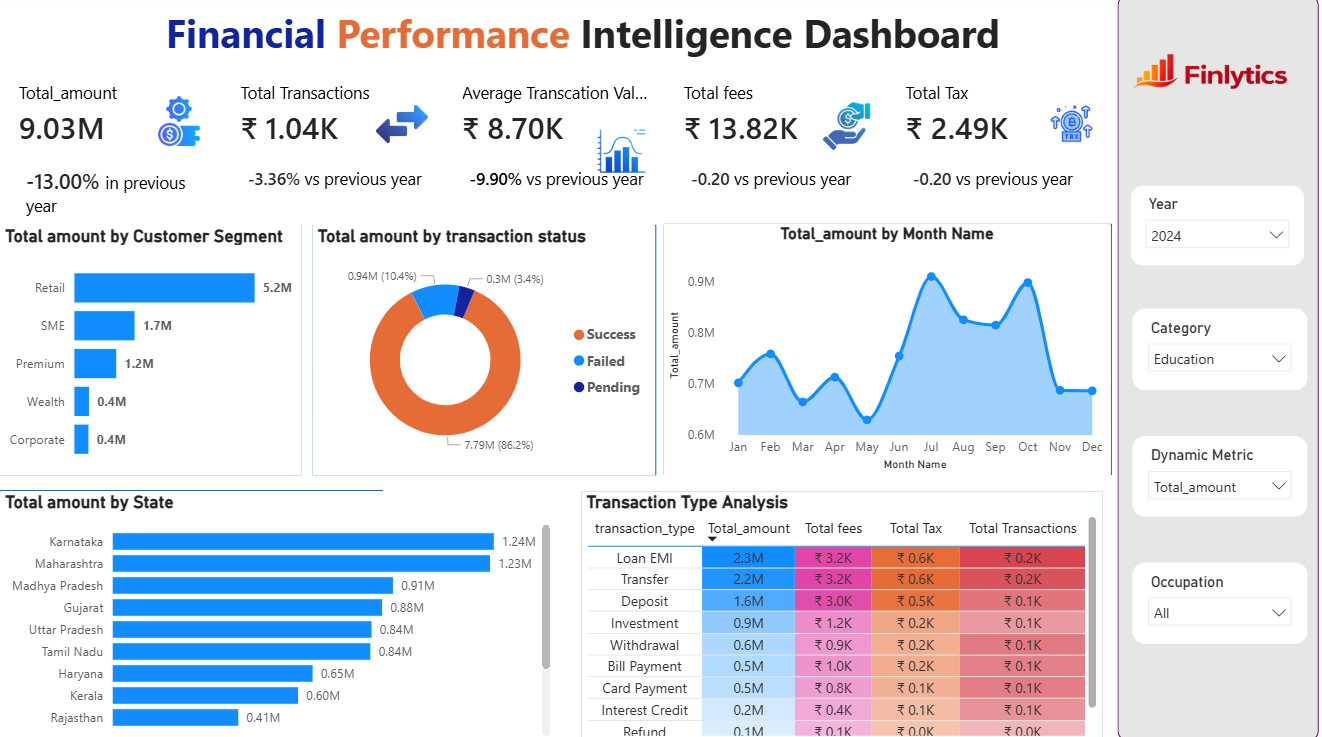
Financial Performance Intelligence Dashboard
Built a comprehensive Power BI financial analytics dashboard tracking transaction counts, amounts, fees, and tax distributions across customer segments and states using a star-schema model.
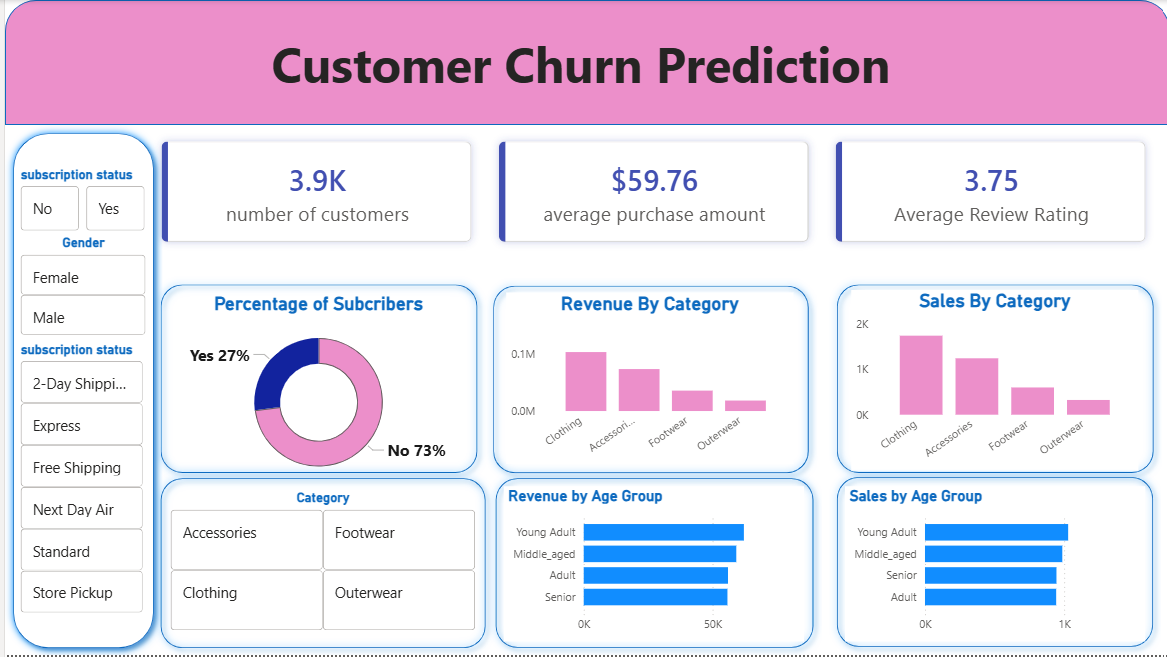
Customer Churn Prediction
Built an end-to-end analytics pipeline analyzing 3.9K+ customer records to identify churn risk. Covers EDA in Python/Jupyter, 10 SQL business questions, and an interactive Power BI dashboard.
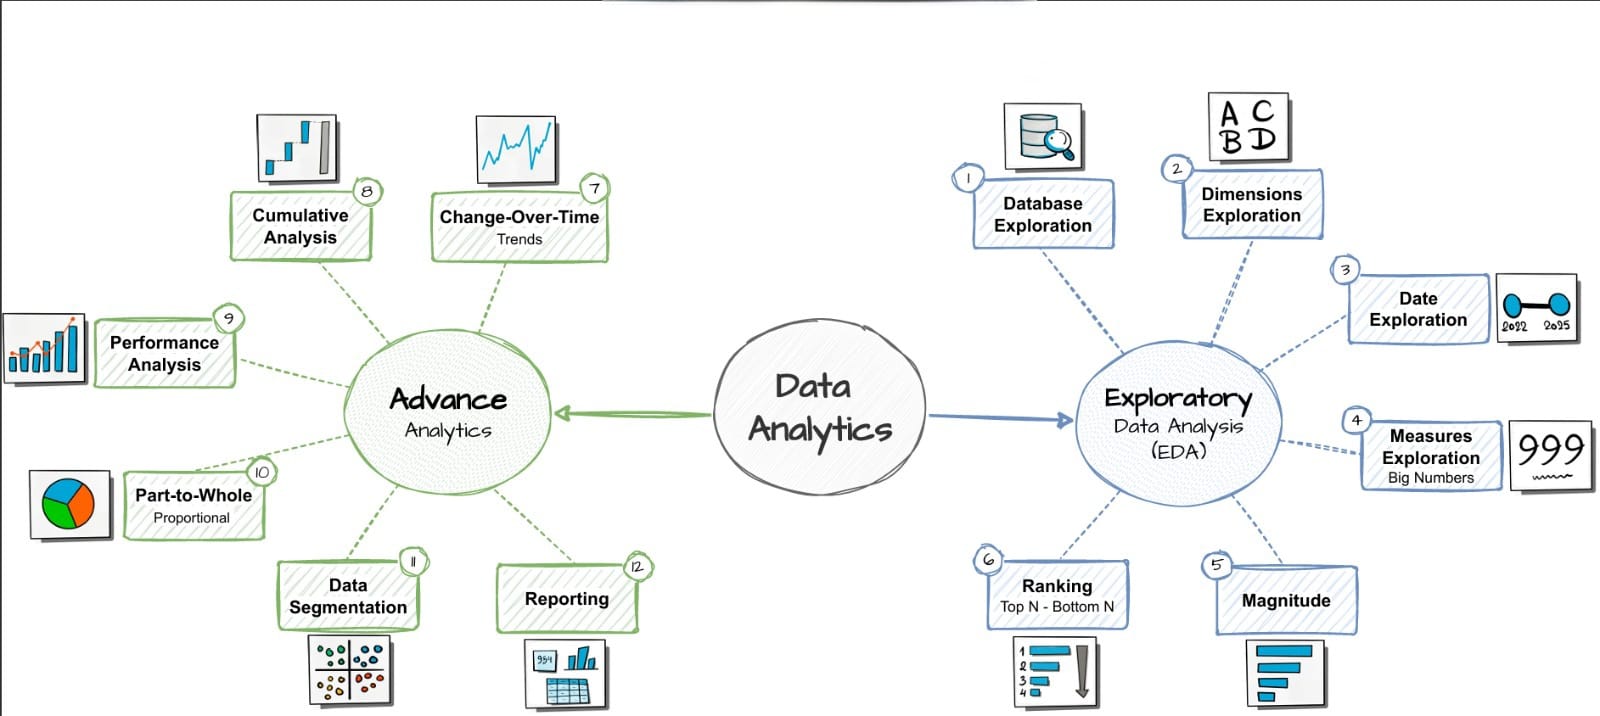
EDA & Advanced Analytics on Data Warehouse
Comprehensive SQL EDA and business analytics scripts built on the Gold layer of the Medallion Data Warehouse.